
What August 2026 looked like
Fourteen products across ten categories, five of them from Sonoff: August was a month of small, cheap devices, with a median launch price of $39.98 even though its range still reached $1,499.99. It was also an unusually interoperable one, with six of its releases supporting Matter and nine working with SmartThings, both well above what the catalog averages.
- 14smart home products launched in August 2026, spread across ten categories.
- 5of the fourteen August launches came from Sonoff, more than any other brand.
- $39.98was the median price of the products released in August 2026, in a month that ran from a $13.90 smart plug to a $1,499.99 robot vacuum.
- $84.99is the median price across the catalog.
- 27.5%of the products we track support Matter, up 0.8 points since July 2026. Six of August's fourteen launches shipped with it.
- 9of the fourteen August launches work with SmartThings, against 49.5% across the catalog.
What came out in August 2026
Everything in this part is measured over the products released during the month.
Products released in August 2026
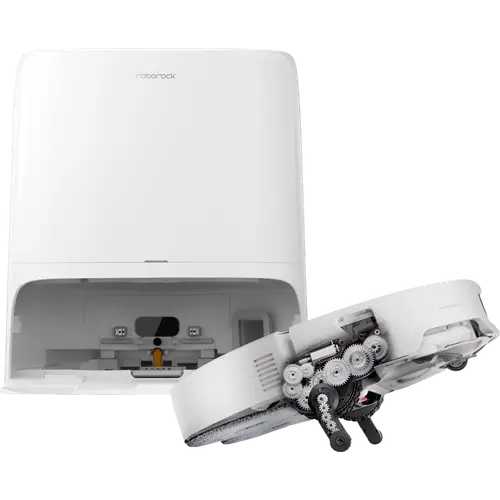
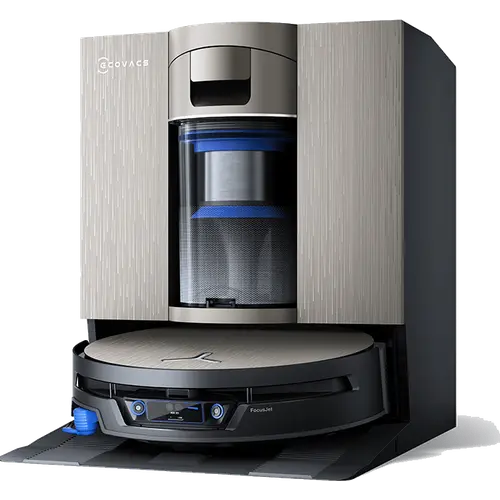
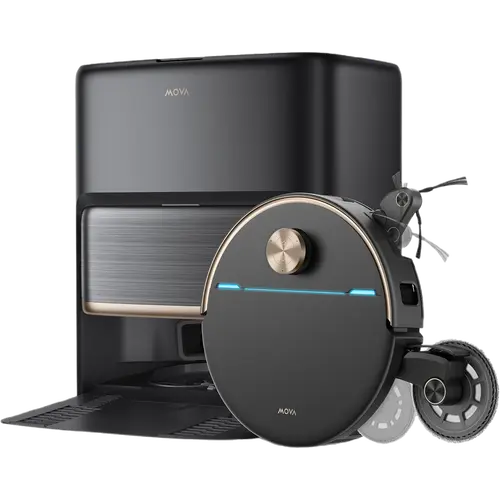
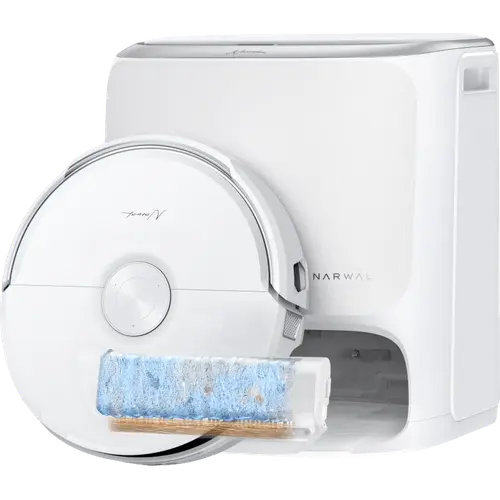
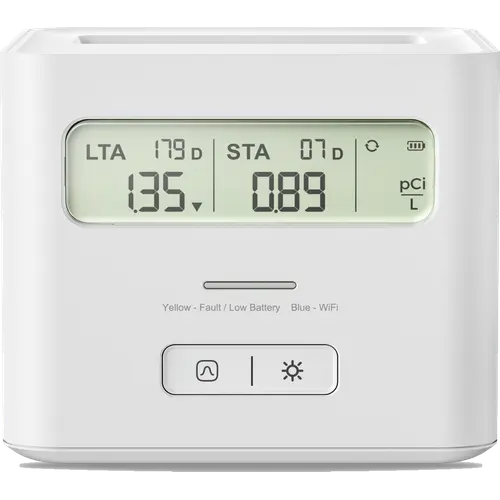

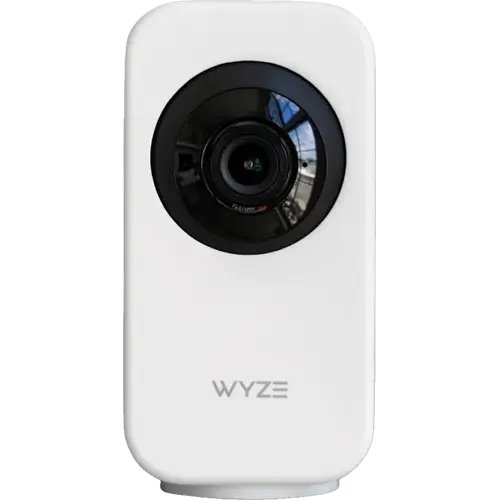

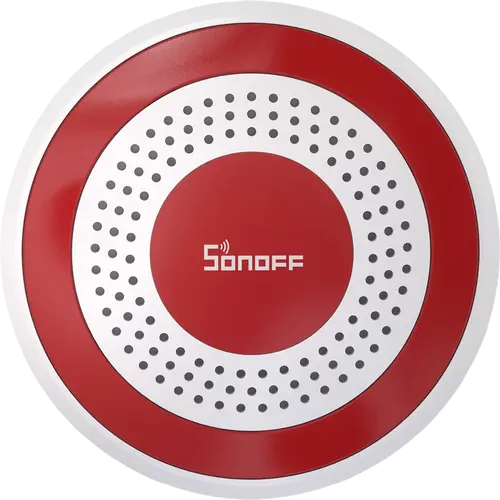
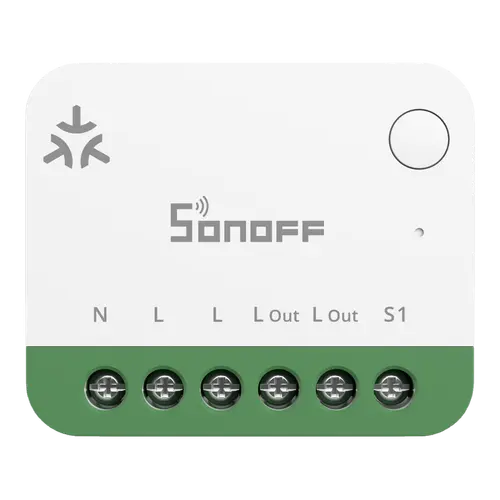
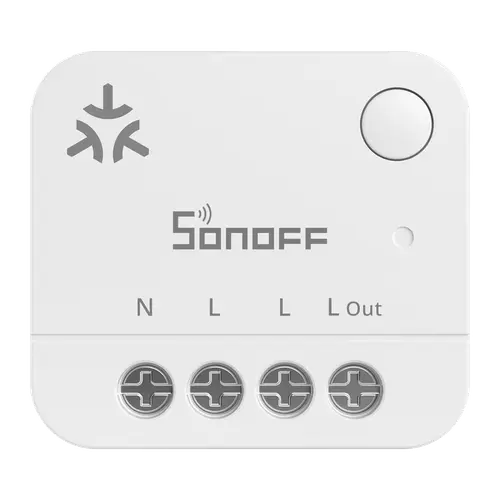
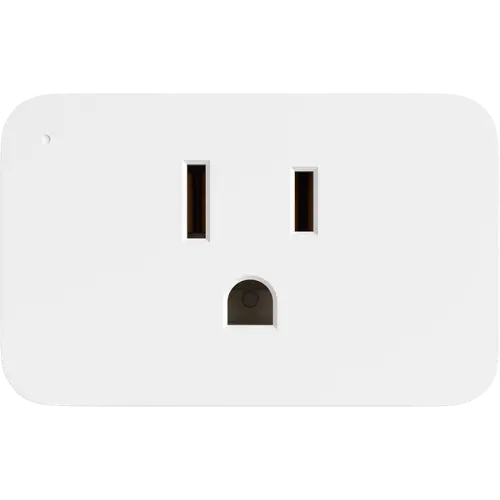
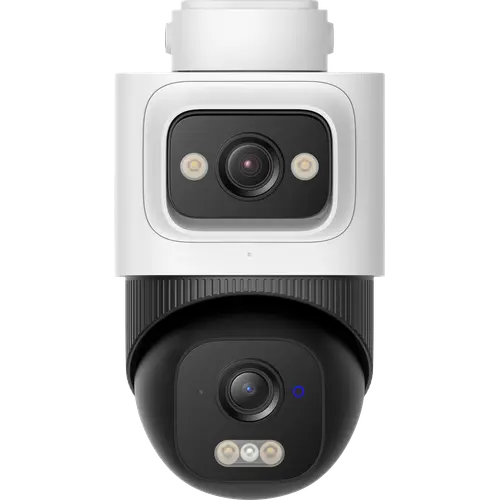
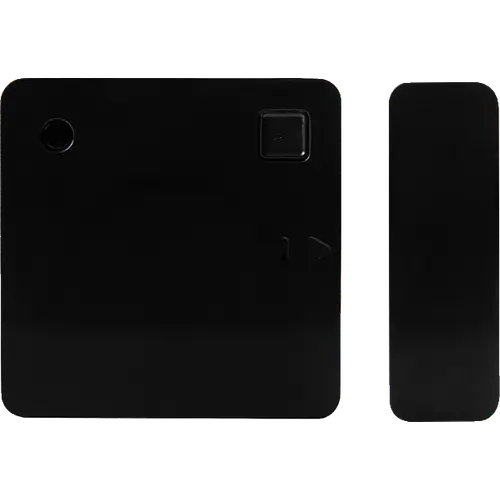
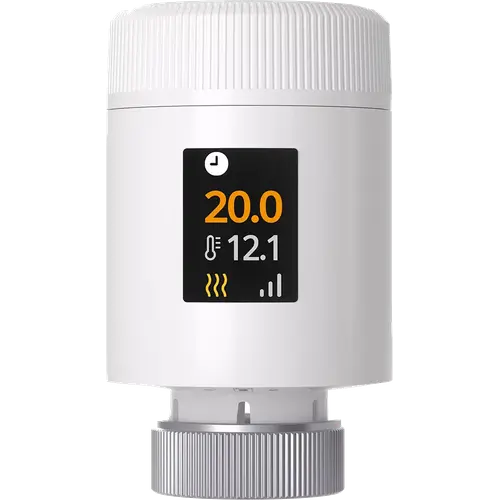
See all 14 products as a table
Which categories moved in August 2026
Where this month's releases landed.
Which brands were most active in August 2026
The manufacturers behind this month's releases, and where they are based.
 #1
#1 #2
#2 #3
#3 #4
#4 #5
#5 #6
#6 #7
#7 #8
#8Where they are based
 China11 products
 Bulgaria2 products
 USA1 product
The state of the smart home
Everything in this part is measured over the whole catalog, as it stood on the report date, against the July 2026 report.
What the catalog covers
Every catalog figure in this report is measured against this catalog, and this is how it is made up.
Each rectangle is a category, and its size is its share of the catalog. Green means the category gained share since the July 2026 report, red means it lost it. Hover a small one to see which it is.
| Category | Products | Share of catalog |
|---|---|---|
| Robot Vacuums | 144 | 15.8% |
| Cameras | 109 | 12% |
| Door Locks | 41 | 4.5% |
| Doorbells | 38 | 4.2% |
| Wall Switches | 36 | 4% |
| Dongles | 35 | 3.9% |
| Relays | 34 | 3.7% |
| Air Quality Monitors | 32 | 3.5% |
| Plugs | 32 | 3.5% |
| Water Leak Sensors | 32 | 3.5% |
| Temperature & Humidity Sensors | 31 | 3.4% |
| Door & Window Sensors | 27 | 3% |
Show the remaining 20 categories
| Category | Products | Share of catalog |
|---|---|---|
| Motion Sensors | 27 | 3% |
| Air Purifiers | 26 | 2.9% |
| Hubs | 26 | 2.9% |
| Robot Lawn Mowers | 25 | 2.8% |
| LED Bulbs | 24 | 2.6% |
| Energy Monitors | 22 | 2.4% |
| Thermostats | 20 | 2.2% |
| Voice Assistants | 19 | 2.1% |
| Smoke & CO Detectors | 18 | 2% |
| Displays | 15 | 1.7% |
| IR Remote Controls | 14 | 1.5% |
| Presence Sensors | 13 | 1.4% |
| Radiator Valves | 11 | 1.2% |
| Water Valves | 11 | 1.2% |
| Wall Outlets | 10 | 1.1% |
| Garage Door Openers | 9 | 1% |
| Light Strips | 9 | 1% |
| Gas Detectors | 7 | 0.8% |
| Sirens | 7 | 0.8% |
| Vibration Sensors | 5 | 0.6% |
The catalog by launch year
| Launch year | Products | Share of catalog |
|---|---|---|
| 2026 (in progress) | 128 | 14.1% |
| 2025 | 210 | 23.1% |
| 2024 | 172 | 18.9% |
| 2023 | 115 | 12.7% |
| 2022 | 67 | 7.4% |
| 2021 | 84 | 9.2% |
| 2020 | 51 | 5.6% |
| 2019 | 38 | 4.2% |
Show every launch year
| Launch year | Products | Share of catalog |
|---|---|---|
| 2018 | 18 | 2% |
| 2017 | 7 | 0.8% |
| 2016 | 7 | 0.8% |
| 2015 | 6 | 0.7% |
| 2014 | 3 | 0.3% |
| 2013 | 2 | 0.2% |
| 2011 | 1 | 0.1% |
What the smart home costs in August 2026
Every product we track that lists a price, as of the report date, against the July 2026 report.
Where every category sits, and where it moved
How the catalog is priced
| Price band | August 2026 | Share |
|---|---|---|
| Under $50 | 291 | 37.6% |
| $50 to $100 | 132 | 17.1% |
| $100 to $250 | 166 | 21.5% |
| $250 and up | 184 | 23.8% |
Prices are what a shopper would pay on the report date, taking the discounted price whenever a discount is running.
Ecosystem compatibility
Which smart home platforms a product can be controlled from, as declared by the manufacturer. Measured across every product we track as of August 2026, with the movement since July 2026.


| Ecosystems | Products | Catalog, August 2026 | vs July 2026 |
|---|---|---|---|
| Home Assistant | 810 | 89.1% | +0.1 pp |
| Amazon Alexa | 760 | 83.6% | +0.8 pp |
| Google Home | 669 | 73.6% | +0.7 pp |
| SmartThings | 450 | 49.5% | +0.4 pp |
| Apple HomeKit | 371 | 40.8% | +0.4 pp |
| Matter | 250 | 27.5% | +0.8 pp |
Percentage points (pp) compare two shares directly.
Ecosystem compatibility, one by one
Where each one stands, and the categories leading and lagging on it.
Home Assistant- Strongest
- Wall Switches 100%
- Weakest
- Garage Door Openers 44.4%
Amazon Alexa- Strongest
- Relays 100%
- Weakest
- Gas Detectors 28.6%
Google Home- Strongest
- Relays 100%
- Weakest
- Sirens 14.3%
SmartThings- Strongest
- Thermostats 95%
- Weakest
- Voice Assistants 0%
Apple HomeKit- Strongest
- LED Bulbs 83.3%
- Weakest
- Sirens 0%
Matter- Strongest
- Light Strips 66.7%
- Weakest
- Sirens 0%
Ecosystem compatibility by category
The whole picture in one grid: every category against every option, and how much of that category supports it. Darker means a bigger share of the products in that row.
| Category | Home Assistant | Amazon Alexa | Google Home | SmartThings | Apple HomeKit | Matter |
|---|---|---|---|---|---|---|
| Hubs | 96.2% | 100% | 100% | 92.3% | 80.8% | 76.9% |
| Radiator Valves | 100% | 100% | 100% | 81.8% | 72.7% | 63.6% |
| Plugs | 96.9% | 100% | 84.4% | 90.6% | 78.1% | 59.4% |
| Relays | 100% | 100% | 100% | 85.3% | 61.8% | 61.8% |
| LED Bulbs | 95.8% | 100% | 95.8% | 87.5% | 83.3% | 33.3% |
| Thermostats | 95% | 100% | 95% | 95% | 70% | 30% |
| Light Strips | 77.8% | 88.9% | 88.9% | 77.8% | 77.8% | 66.7% |
| Wall Switches | 100% | 88.9% | 83.3% | 75% | 66.7% | 55.6% |
| Presence Sensors | 100% | 92.3% | 84.6% | 69.2% | 61.5% | 46.2% |
| Door Locks | 78% | 97.6% | 97.6% | 58.5% | 61% | 51.2% |
| Wall Outlets | 100% | 100% | 100% | 50% | 40% | 30% |
| Temperature & Humidity Sensors | 87.1% | 83.9% | 67.7% | 77.4% | 54.8% | 48.4% |
| Robot Vacuums | 86.8% | 99.3% | 98.6% | 42.4% | 42.4% | 42.4% |
| IR Remote Controls | 92.9% | 100% | 100% | 42.9% | 35.7% | 21.4% |
| Door & Window Sensors | 88.9% | 88.9% | 59.3% | 70.4% | 48.1% | 37% |
| Motion Sensors | 85.2% | 81.5% | 48.1% | 70.4% | 48.1% | 44.4% |
| Water Valves | 90.9% | 90.9% | 72.7% | 54.5% | 45.5% | 18.2% |
| Cameras | 89.9% | 89% | 78% | 37.6% | 28.4% | 4.6% |
| Energy Monitors | 100% | 59.1% | 59.1% | 54.5% | 22.7% | 22.7% |
| Displays | 93.3% | 80% | 26.7% | 20% | 20% | n/a |
| Doorbells | 78.9% | 97.4% | 60.5% | 26.3% | 18.4% | 0% |
| Water Leak Sensors | 84.4% | 53.1% | 40.6% | 50% | 37.5% | 15.6% |
| Air Quality Monitors | 90.6% | 59.4% | 53.1% | 18.8% | 25% | 15.6% |
| Air Purifiers | 53.8% | 84.6% | 76.9% | 15.4% | 15.4% | 15.4% |
| Smoke & CO Detectors | 88.9% | 44.4% | 55.6% | 33.3% | 16.7% | 16.7% |
| Robot Lawn Mowers | 88% | 88% | 64% | 0% | 0% | 0% |
| Voice Assistants | 100% | 57.9% | 26.3% | 0% | 10.5% | n/a |
| Garage Door Openers | 44.4% | 55.6% | 55.6% | 44.4% | 22.2% | 11.1% |
Connectivity protocols
Which radios a product ships with. A product can carry more than one, so these shares do not add up to 100%. Measured across every product we track as of August 2026, with the movement since July 2026.


| Protocols | Products | Catalog, August 2026 | vs July 2026 |
|---|---|---|---|
| 2.4 GHz Wi-Fi | 630 | 69.3% | +0.5 pp |
| Bluetooth | 286 | 31.5% | +3.5 pp |
| Zigbee | 143 | 15.7% | +0.2 pp |
| 5 GHz Wi-Fi | 122 | 13.4% | +0.4 pp |
| Ethernet | 63 | 6.9% | -0.3 pp |
| Thread | 41 | 4.5% | -0.2 pp |
| Z-Wave | 23 | 2.5% | -0.3 pp |
| 6 GHz Wi-Fi | 6 | 0.7% | 0 pp |
Percentage points (pp) compare two shares directly.
Connectivity protocols, one by one
Where each one stands, and the categories leading and lagging on it.
2.4 GHz Wi-Fi- Strongest
- Doorbells 100%
- Weakest
- Vibration Sensors 0%
Bluetooth- Strongest
- Voice Assistants 100%
- Weakest
- Gas Detectors 0%
Zigbee- Strongest
- Vibration Sensors 100%
- Weakest
- Garage Door Openers 0%
5 GHz Wi-Fi- Strongest
- Voice Assistants 94.7%
- Weakest
- Vibration Sensors 0%
Ethernet- Strongest
- Hubs 69.2%
- Weakest
- Air Purifiers 0%
Thread- Strongest
- Radiator Valves 27.3%
- Weakest
- Sirens 0%
Z-Wave- Strongest
- Sirens 28.6%
- Weakest
- Vibration Sensors 0%
6 GHz Wi-Fi- Strongest
- Displays 26.7%
- Weakest
- Voice Assistants 10.5%
Adoption by product launch year
The same measurement, split by the year each product was released. It shows what manufacturers were shipping each year, not what the installed base looks like.
| Launch year | Matter | Zigbee | Thread | Z-Wave |
|---|---|---|---|---|
| 2018 | 22.2% | 44.4% | 0% | 0% |
| 2019 | 9.4% | 18.8% | 0% | 6.3% |
| 2020 | 22.9% | 33.3% | 2.1% | 8.3% |
| 2021 | 21.8% | 30.8% | 1.3% | 10.3% |
| 2022 | 10% | 15% | 5% | 0% |
| 2023 | 28.4% | 16.7% | 5.9% | 1% |
| 2024 | 32.7% | 10.7% | 8% | 2% |
| 2025 | 41.8% | 10.9% | 6.5% | 0.5% |
| 2026 (in progress) | 44.2% | 19.2% | 5% | 0% |
Connectivity protocols by category
The whole picture in one grid: every category against every option, and how much of that category supports it. Darker means a bigger share of the products in that row.
| Category | 2.4 GHz Wi-Fi | Bluetooth | Zigbee | 5 GHz Wi-Fi | Ethernet | Thread | Z-Wave | 6 GHz Wi-Fi |
|---|---|---|---|---|---|---|---|---|
| Voice Assistants | 100% | 100% | n/a | 94.7% | 5.3% | n/a | n/a | 10.5% |
| Displays | 100% | 93.3% | n/a | 80% | 6.7% | n/a | n/a | 26.7% |
| Light Strips | 66.7% | 88.9% | 22.2% | 0% | n/a | 0% | n/a | n/a |
| Thermostats | 100% | 40% | 5% | 50% | n/a | 5% | 0% | n/a |
| LED Bulbs | 33.3% | 70.8% | 62.5% | 0% | n/a | 4.2% | 0% | n/a |
| Door Locks | 73.2% | 56.1% | 7.3% | 0% | n/a | 24.4% | 0% | n/a |
| Energy Monitors | 81.8% | 40.9% | 27.3% | 0% | 27.3% | 0% | 4.5% | n/a |
| Radiator Valves | 18.2% | 45.5% | 63.6% | 0% | n/a | 27.3% | 0% | n/a |
| Plugs | 59.4% | 53.1% | 21.9% | 0% | n/a | 9.4% | 9.4% | n/a |
| Presence Sensors | 38.5% | 46.2% | 53.8% | 0% | n/a | 7.7% | 0% | n/a |
| IR Remote Controls | 100% | n/a | 0% | 7.1% | 7.1% | 7.1% | n/a | n/a |
| Relays | 32.4% | 50% | 61.8% | 0% | n/a | 0% | 0% | n/a |
| Robot Vacuums | 99.3% | 29.9% | 0% | 14.6% | n/a | 0% | 0% | n/a |
| Garage Door Openers | 88.9% | 44.4% | 0% | 0% | 11.1% | 0% | 0% | n/a |
| Air Quality Monitors | 59.4% | 65.6% | 6.3% | 6.3% | 3.1% | 3.1% | 0% | n/a |
| Smoke & CO Detectors | 66.7% | 16.7% | 11.1% | 0% | n/a | 11.1% | 5.6% | n/a |
| Wall Switches | 38.9% | 8.3% | 38.9% | 2.8% | n/a | 11.1% | 11.1% | n/a |
| Water Valves | 18.2% | 45.5% | 36.4% | 0% | n/a | 9.1% | 0% | n/a |
| Air Purifiers | 100% | 23.1% | 0% | 0% | 0% | 0% | 0% | n/a |
| Temperature & Humidity Sensors | 12.9% | 38.7% | 35.5% | 0% | n/a | 9.7% | 6.5% | n/a |
| Water Leak Sensors | 43.8% | 21.9% | 28.1% | 0% | n/a | 3.1% | 6.3% | n/a |
| Wall Outlets | 70% | 0% | 20% | 0% | n/a | 10% | 0% | n/a |
| Motion Sensors | 11.1% | 25.9% | 37% | 0% | n/a | 14.8% | 11.1% | n/a |
| Door & Window Sensors | 14.8% | 22.2% | 29.6% | 0% | n/a | 11.1% | 18.5% | n/a |
How these numbers are built
How every figure in this report is built.
Where the data comes from
Every figure is computed from our own product catalog, each product documented feature by feature against the spec sheet its category defines. The numbers are resolved once, when the report is published, and never recomputed: an edition is a snapshot of the month it covers, so a figure cited here reads the same a year later.
What the catalog figures measure
The state of the catalog (platform and protocol adoption, prices) is measured across every product we track as of the report date, not only the new ones. That is the number that describes the market and the one worth citing.
What the launch figures cover
Launches are the products in our catalog whose release date falls in August 2026. A single month is a small, early signal of where the market is heading, never a measurement of it.
What each share is a share of
Every share in a chapter divides by the same number: the products in the categories whose spec sheet asks at least one of that chapter's questions. That is what makes the figures comparable with each other. Categories that ask none of them stay out entirely, because counting a product as lacking a feature its category never had would deflate every share with products that were never candidates.
How support is counted
A product counts as supporting a feature only when we have verified that support against the manufacturer's own documentation. Everything else counts as not supported, including the products whose spec sheet leaves the question open.
How prices are measured
Prices all come from a single store, so the medians of two categories are comparable, and they are what a shopper would pay on the report date, discounts included: a report is dated, and on its date that is the price. Products not sold there are left out of the price figures.
How the movement is read
Month-over-month changes compare against the figures published in the previous report, not against a recomputation of that month. Each edition is fixed, so the two never disagree about the same period.
What this data is not
This is a curated catalog, not a census of everything on the market. It covers the products worth comparing in each category, which skews toward what is actually sold and reviewed. Read every figure as a share of what we track, not as a share of the whole market.
Cite this report
These figures are free to reuse. Copy whichever format fits, or take the raw data.
Plain text
Smart Home Compared, "The State of the Smart Home, August 2026", August 2026. https://smarthomecompared.com/reports/august-2026HTML (keeps the link)
<a href="https://smarthomecompared.com/reports/august-2026">The State of the Smart Home, August 2026</a>, Smart Home ComparedAcademic
Smart Home Compared. (2026). The State of the Smart Home, August 2026. Retrieved from https://smarthomecompared.com/reports/august-2026Free to reuse with attribution and a link back to this report.
Download the data
Every figure on this page is in those files, each one with the numerator and denominator behind it, so any share here can be recomputed rather than taken on trust.